
The mandelbrot fractal is recognisable to most people who’ve a passing interest in mathematics, and it’s named after a chap called Benoir Mandelbrot who spent his life discussing fractal theories. However the mandelbrot fractal itself wasn’t discovered by Benoir.
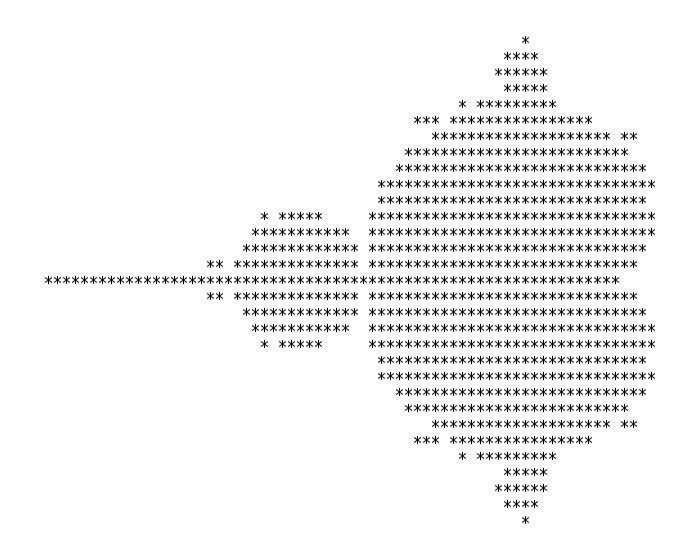
The mandelbrot was first studied by the mathematicians Robert W Brooks and Peter Matelski in 1978. The very first image you’ll find of the set is this one, first published by the pair.
Further study was then carried out by Benoir Mandelbrot, and the fractal eventually become synonymous with his work and became known as “the Mandelbrot set” from the mid 1980s.
Renderings of the fractal became commonplace in the 80s, and it’s easy for you to personally build your own Mandelbrot images using freely available software.

This helped the Mandelbrot to become embedded in popular culture, and it also formed the foundation for a set of mathematics that was popularly coined as Chaos Theory.
If you’ve seen Jurassic Park you may remember the droplet scene, where “mathematician” Malcolm, played by Jeff Goldblum talks about how a droplet that starts on the same place of Ellie’s hand will take different routes dependent on variables such as the hairs on the back of her hand, etc. etc. The point of the example is that in certain systems, small variations in initial conditions can lead to significantly different outcomes.

Another common example is the Butterfly Effect. The origins go back to early weather simulations where researchers discovered that very small changes in initial conditions could lead to vastly different forecasts within a day or two’s time. The butterfly effect refers to the idea that a butterfly flapping it’s wings could change the condition of the atmosphere in a subtle way, which could then lead to a significant weather event like a Tornado in a different country, weeks later.
The Mandelbrot is similarly related to chaos theory as it’s a great example of how very small changes in initial conditions (in this case the x,y coordinate) can have a massive effect on the output of an iterated formula. If you zoom in to the fractal you’ll find that moving a very small amount in the x or y coordinate can be the difference between the formula terminating almost immediately (blue in this case), or continuing forever (black).

The other aspect of the Mandelbrot is it’s fractal nature. There are two aspects to this. Firstly the Mandelbrot is self-similar, i.e. the pattern of the original Mandelbrot appears again and again within the fractal itself.
The second aspect of fractals are that they’re infinitely detailed. You can continue zooming into a fractal until you reach the limits of the accuracy of the numbers you’re using in the calculations that generate the image. And with a proper arbitrary precision implementation you can zoom in for as long as you like, constantly finding more and more detail.
The really amazing aspect of the Mandelbrot is the simplicity of the formula which generates these images, but I’ll talk about that in another post!